While at the data monitoring and analytics company Circonus, I began translating rough sketches and primitive diagrams into detailed, isometric illustrations. Typically, these high-fidelity diagrams would be shared with partners and customers to illuminate the functionality of our technology or the integration of it within another ecosystem. The organized and illustrative nature of the diagrams succeeded in clarifying processes which would otherwise require lengthy explanation. I created dozens of these illustrations throughout my tenure at Circonus. Only a sampling is included below.
Circonus Diagrams
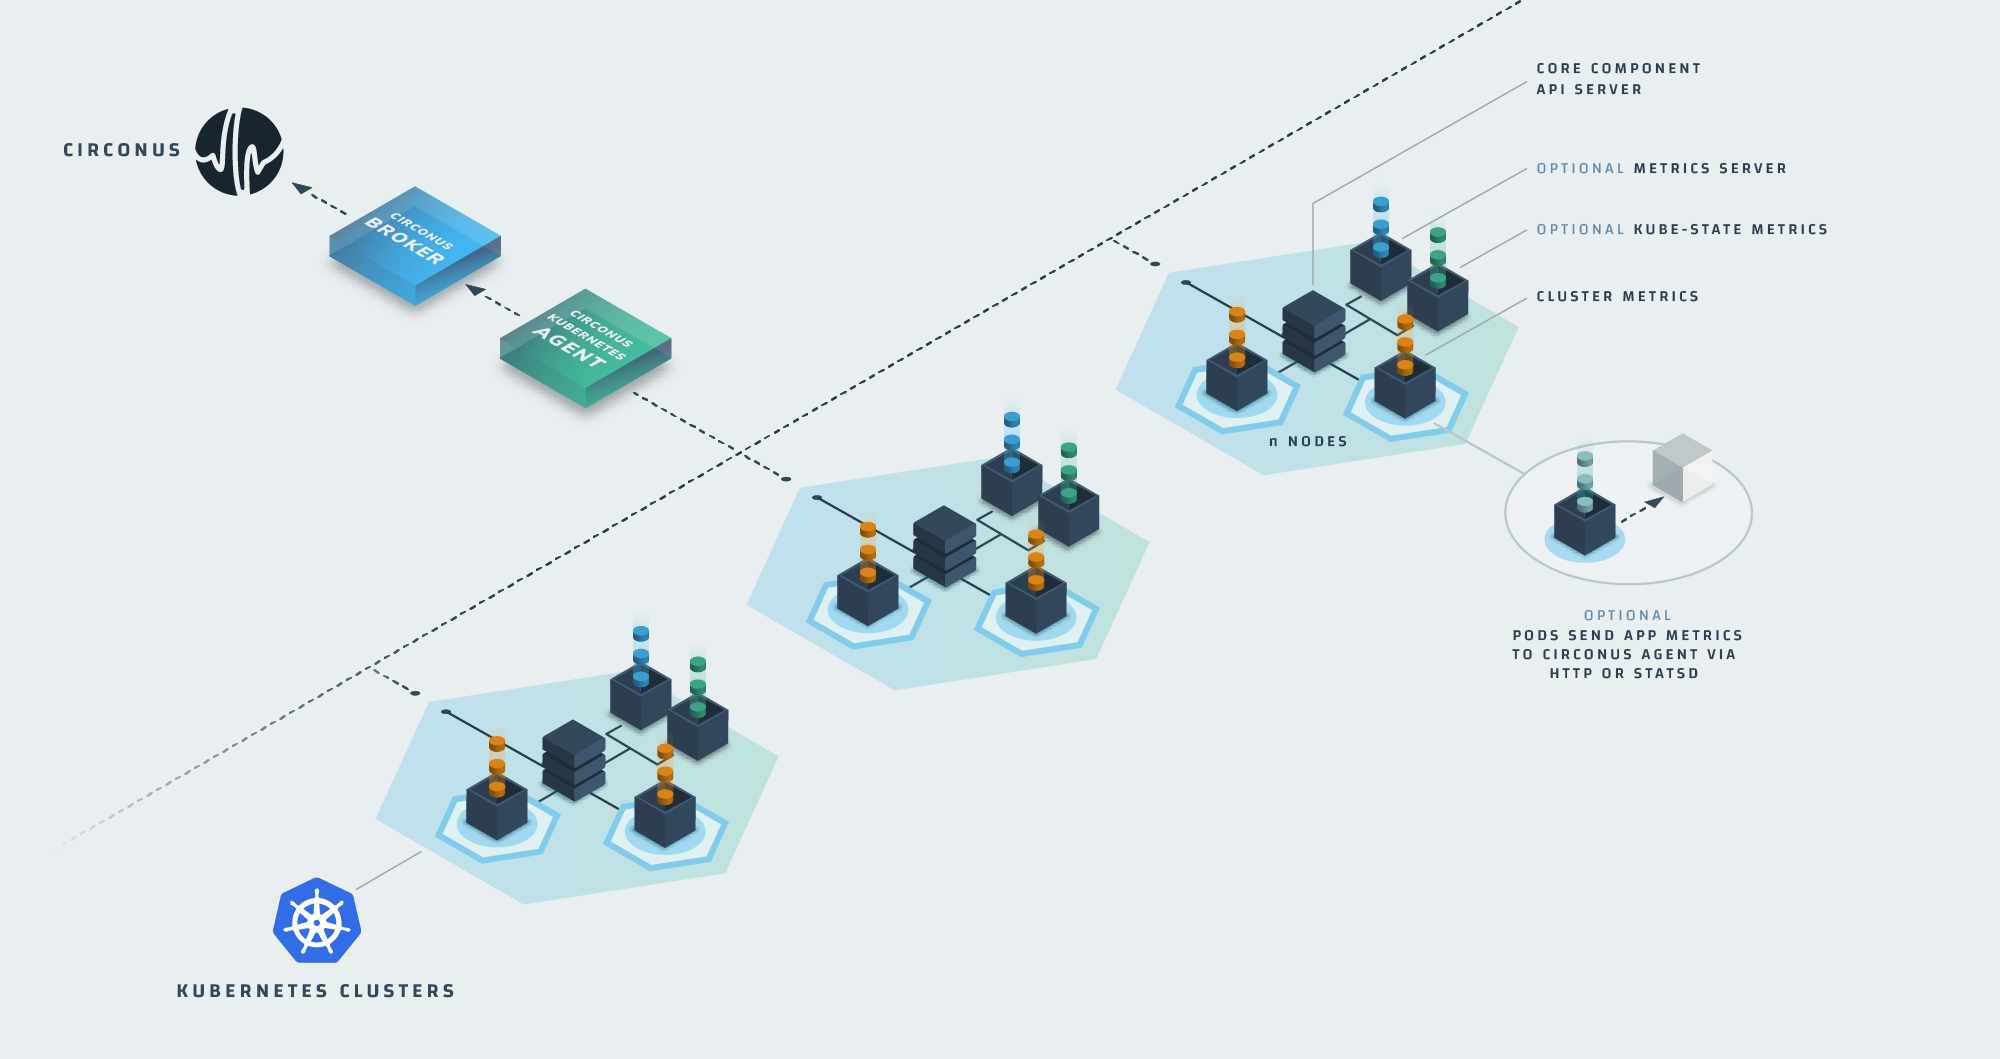
The Circonus Kubernetes Agent collecting data across multiple Kubernetes clusters.
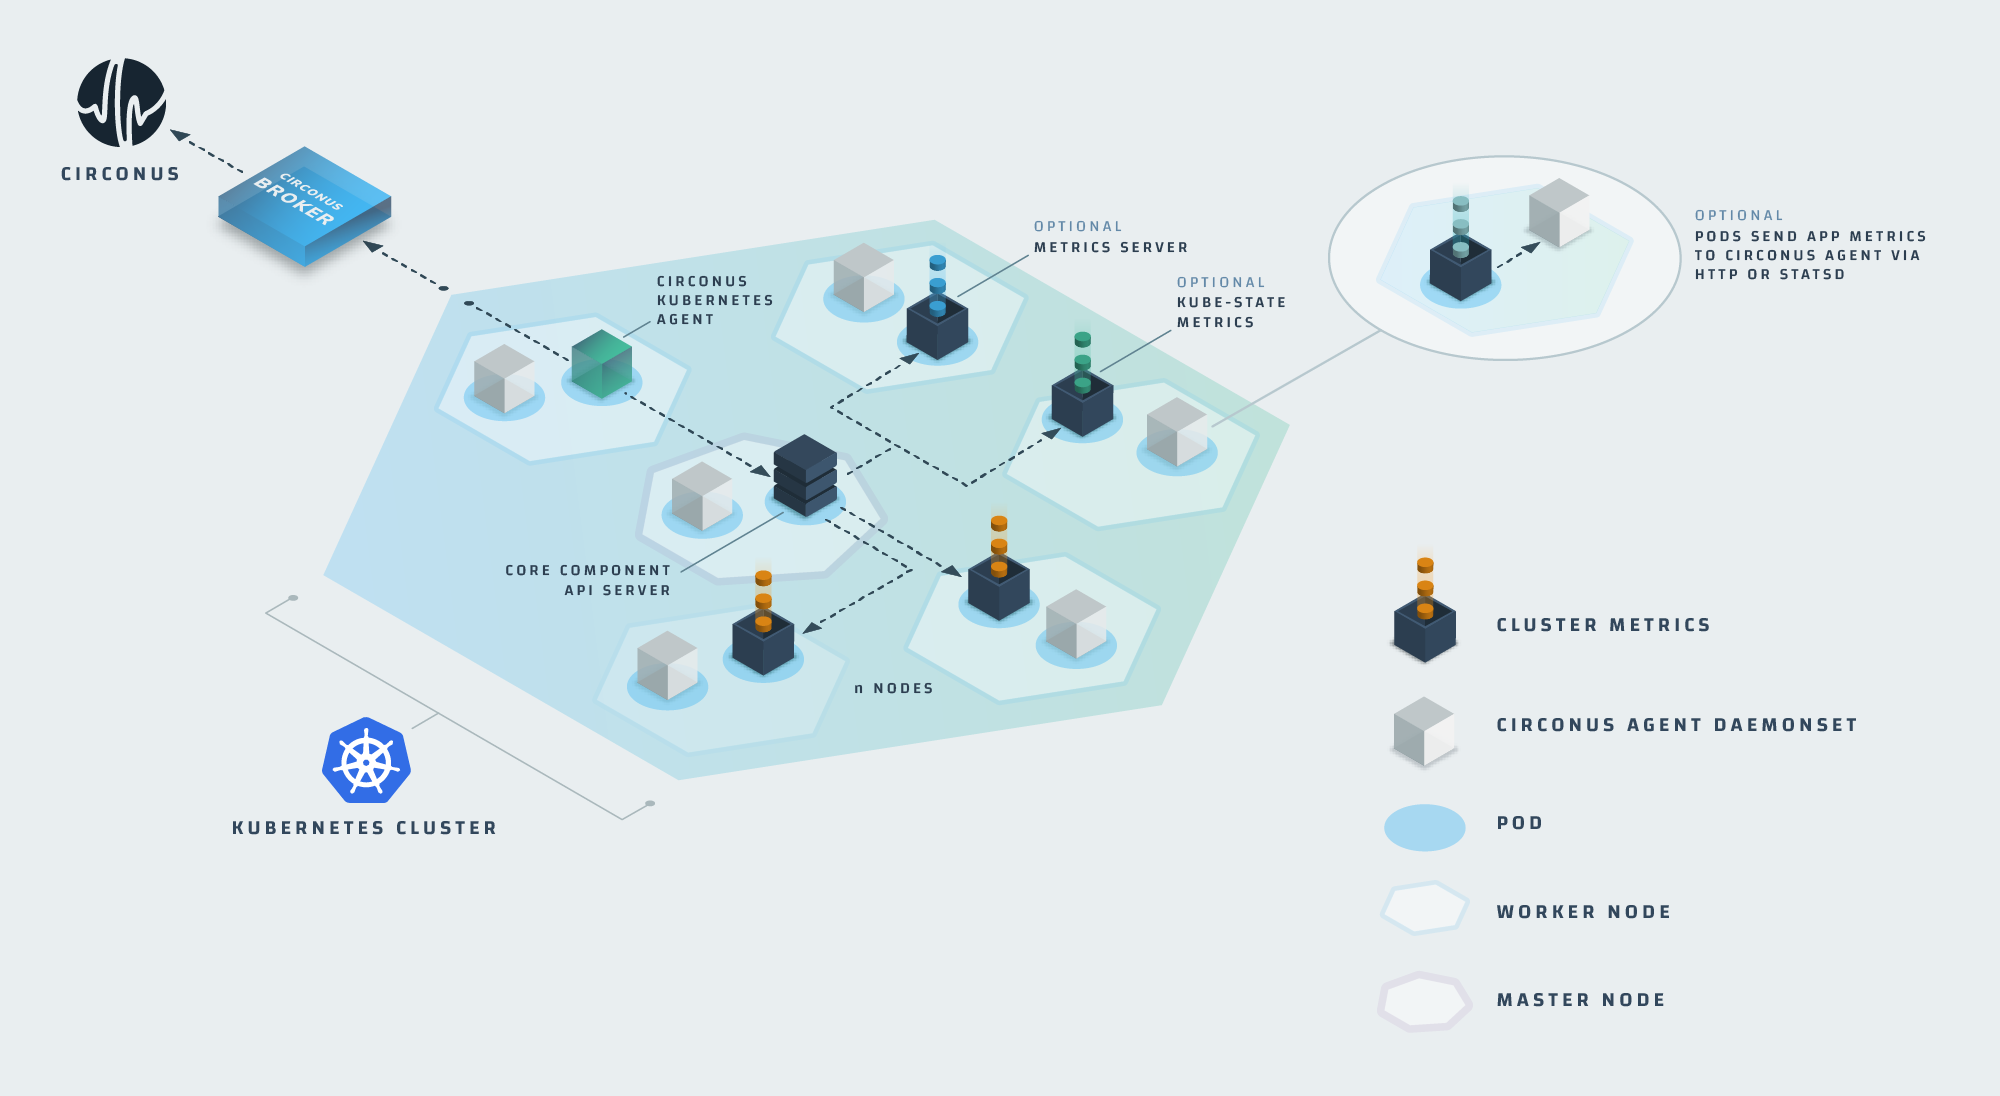
The Circonus Kubernetes Agent collecting data across a single Kubernetes cluster.
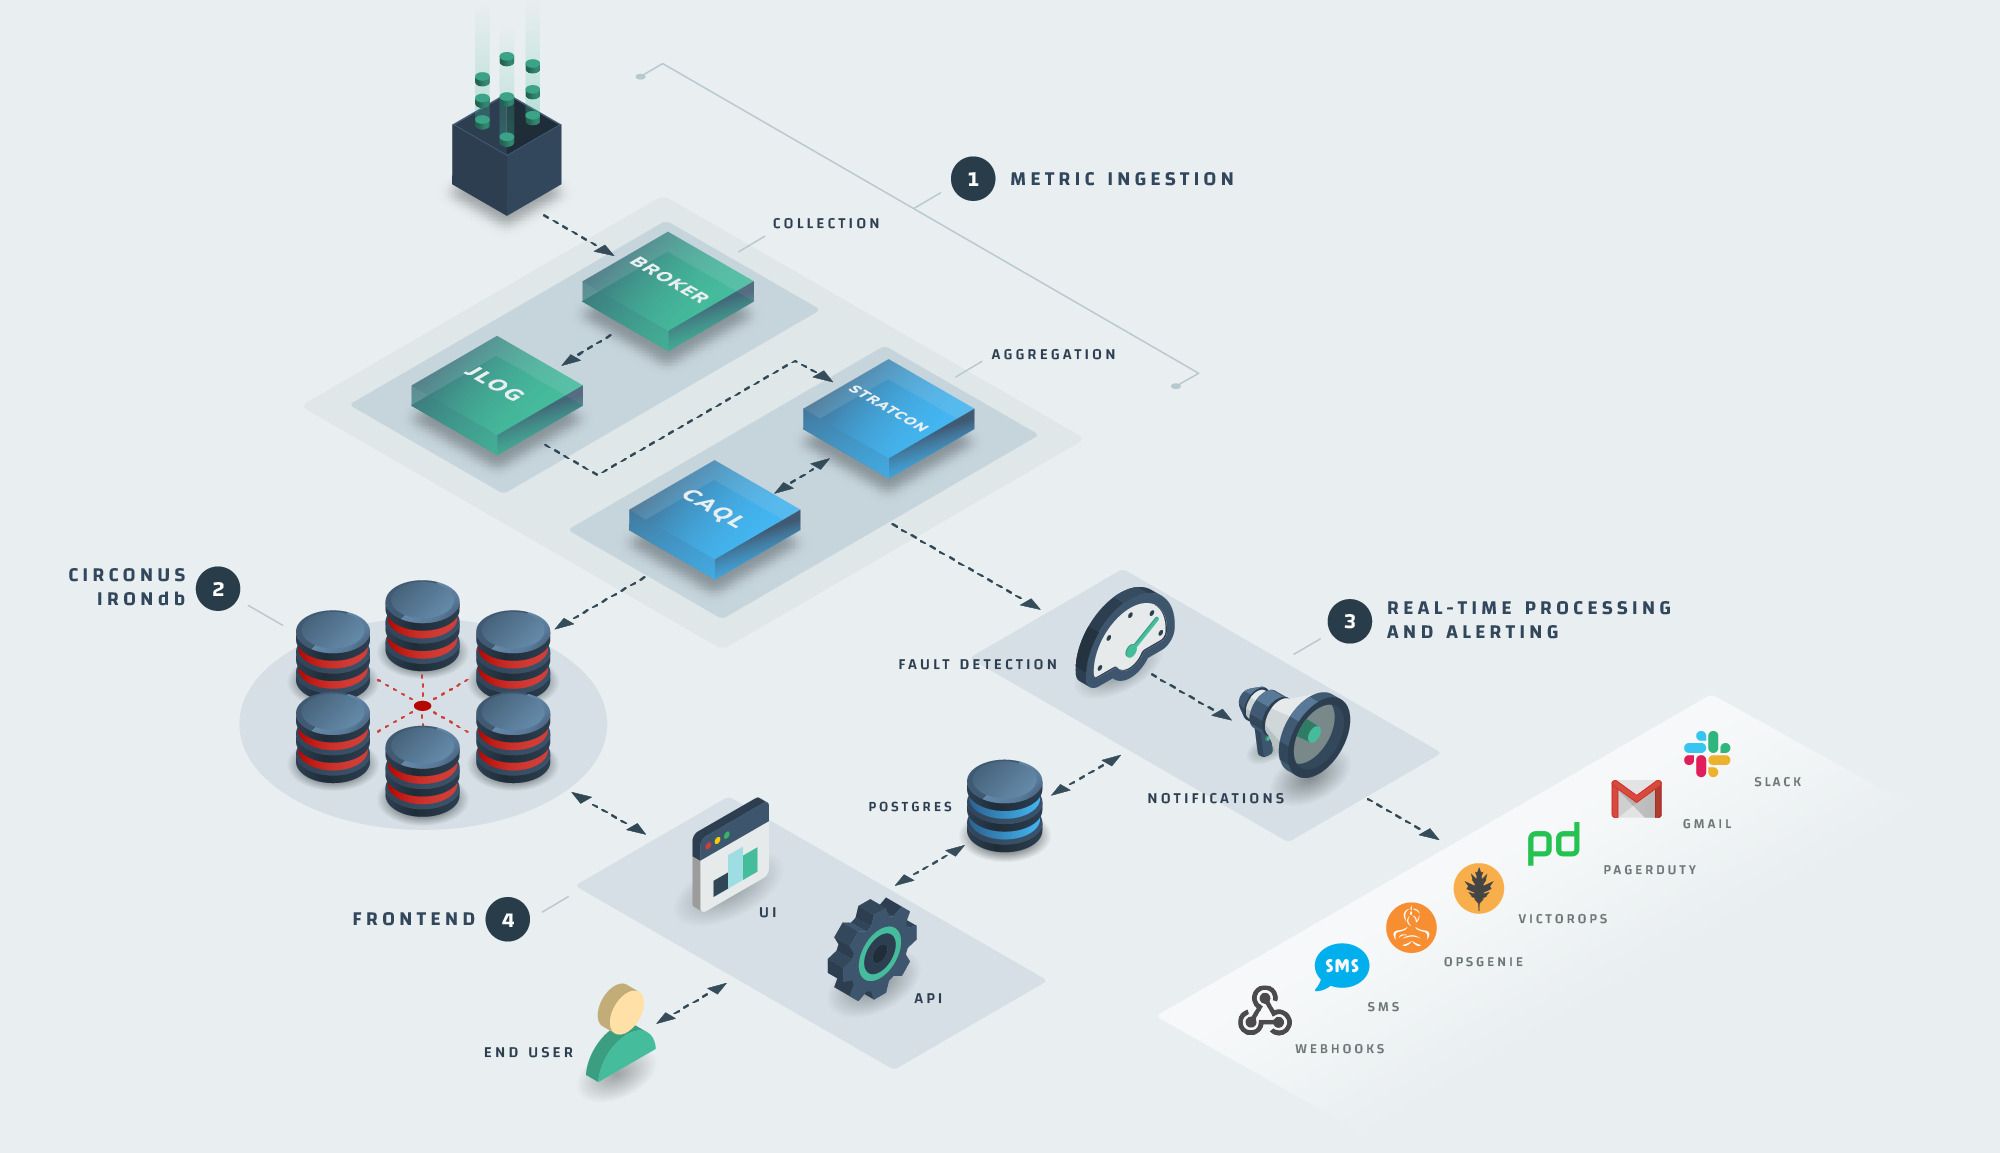
Circonus technology, end-to-end.
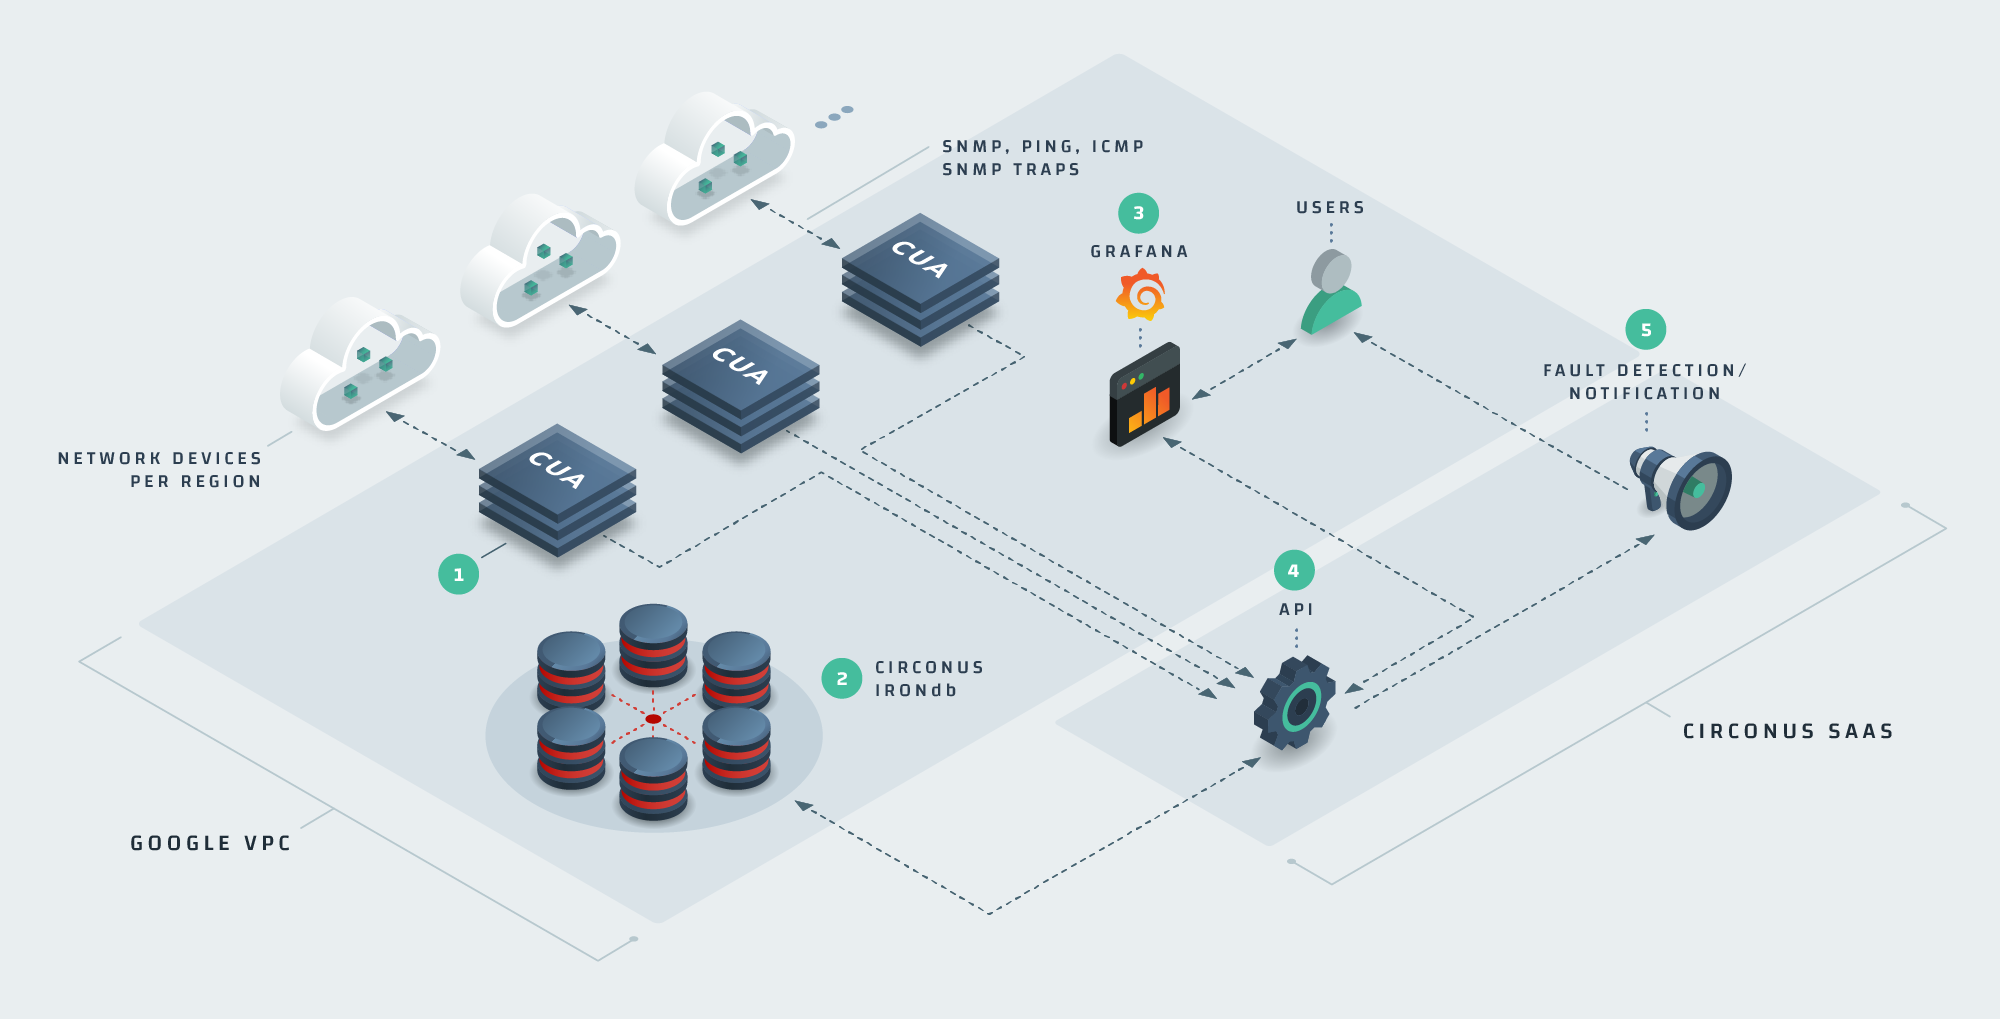
How the Circonus Unified Agent would collect and process data from Google Webpass.
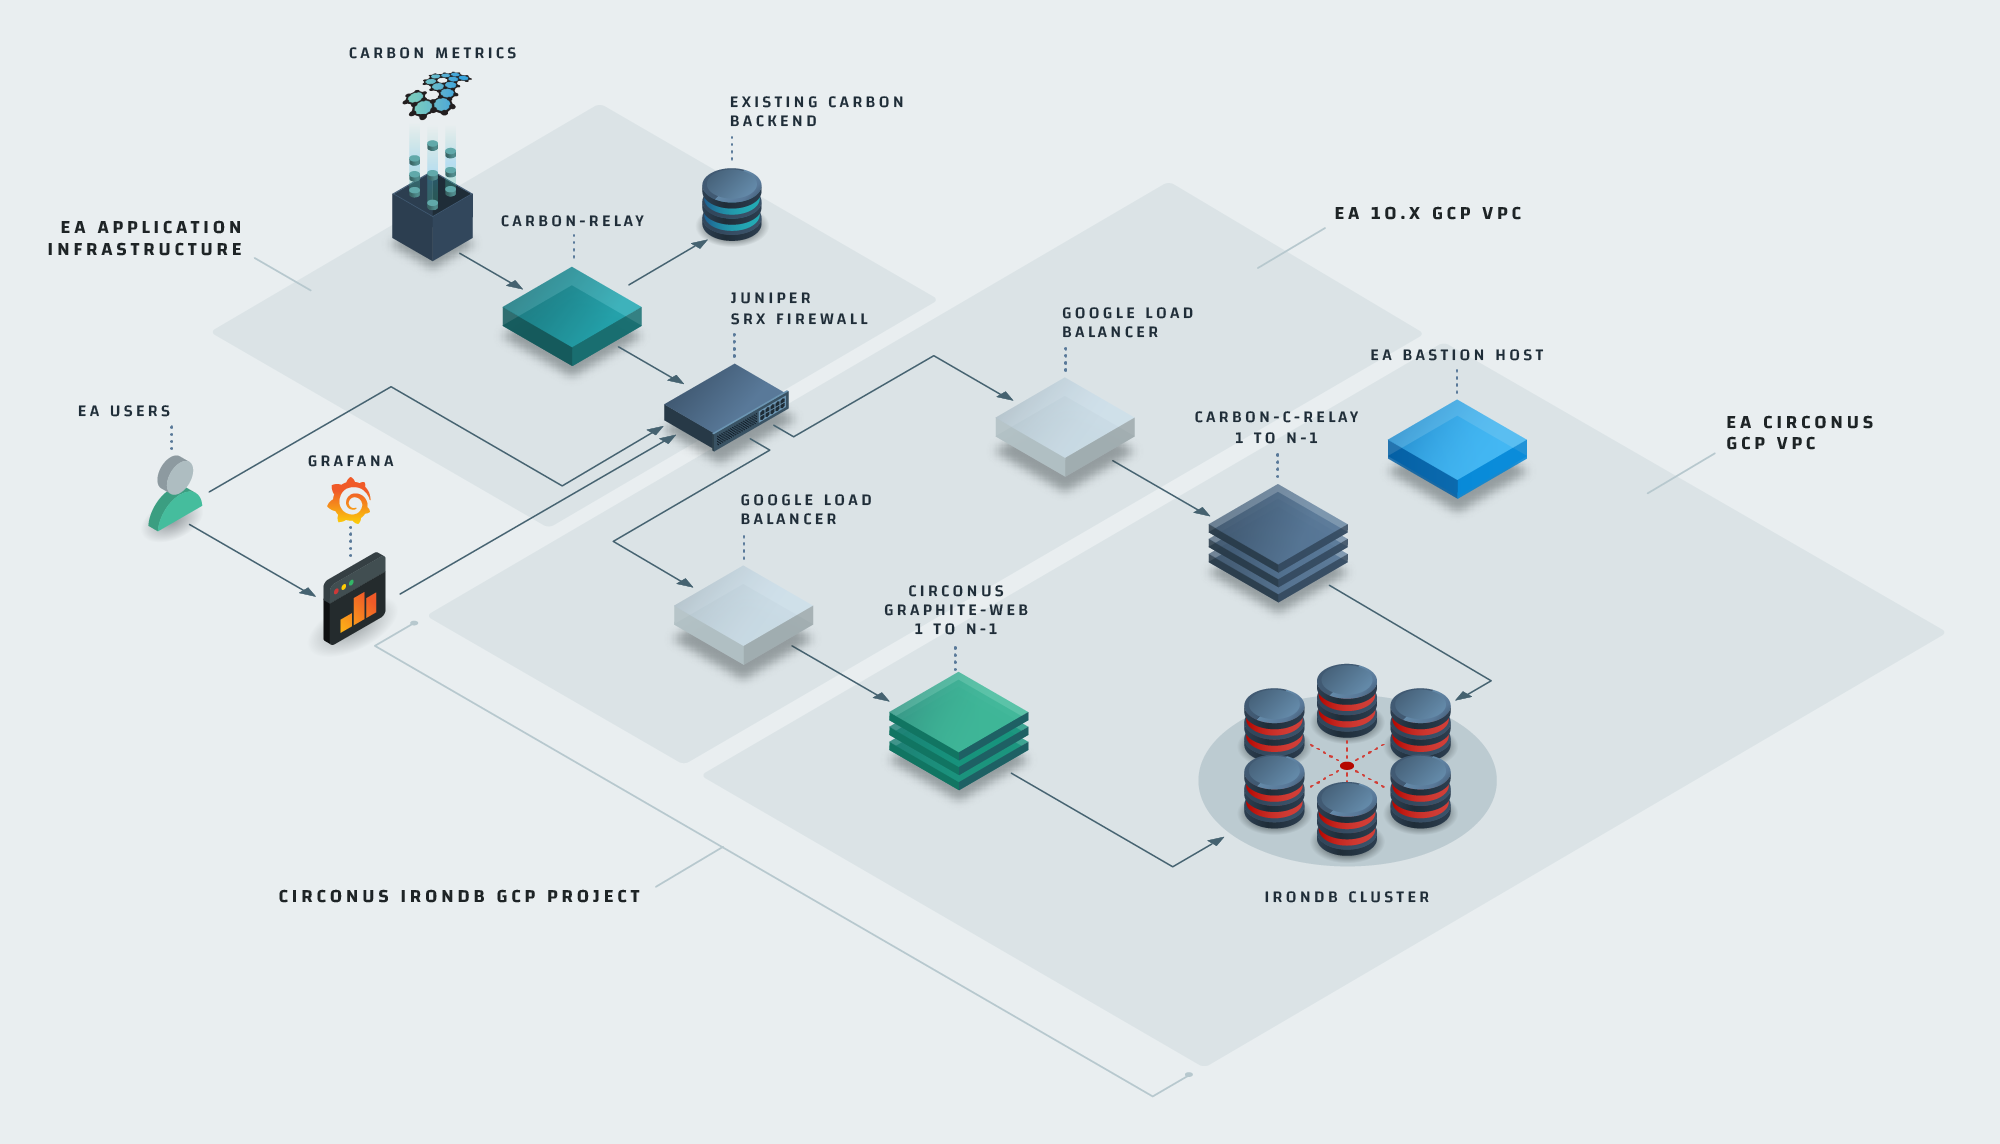
How Circonus would be integrated into a specific client's infrastructure.
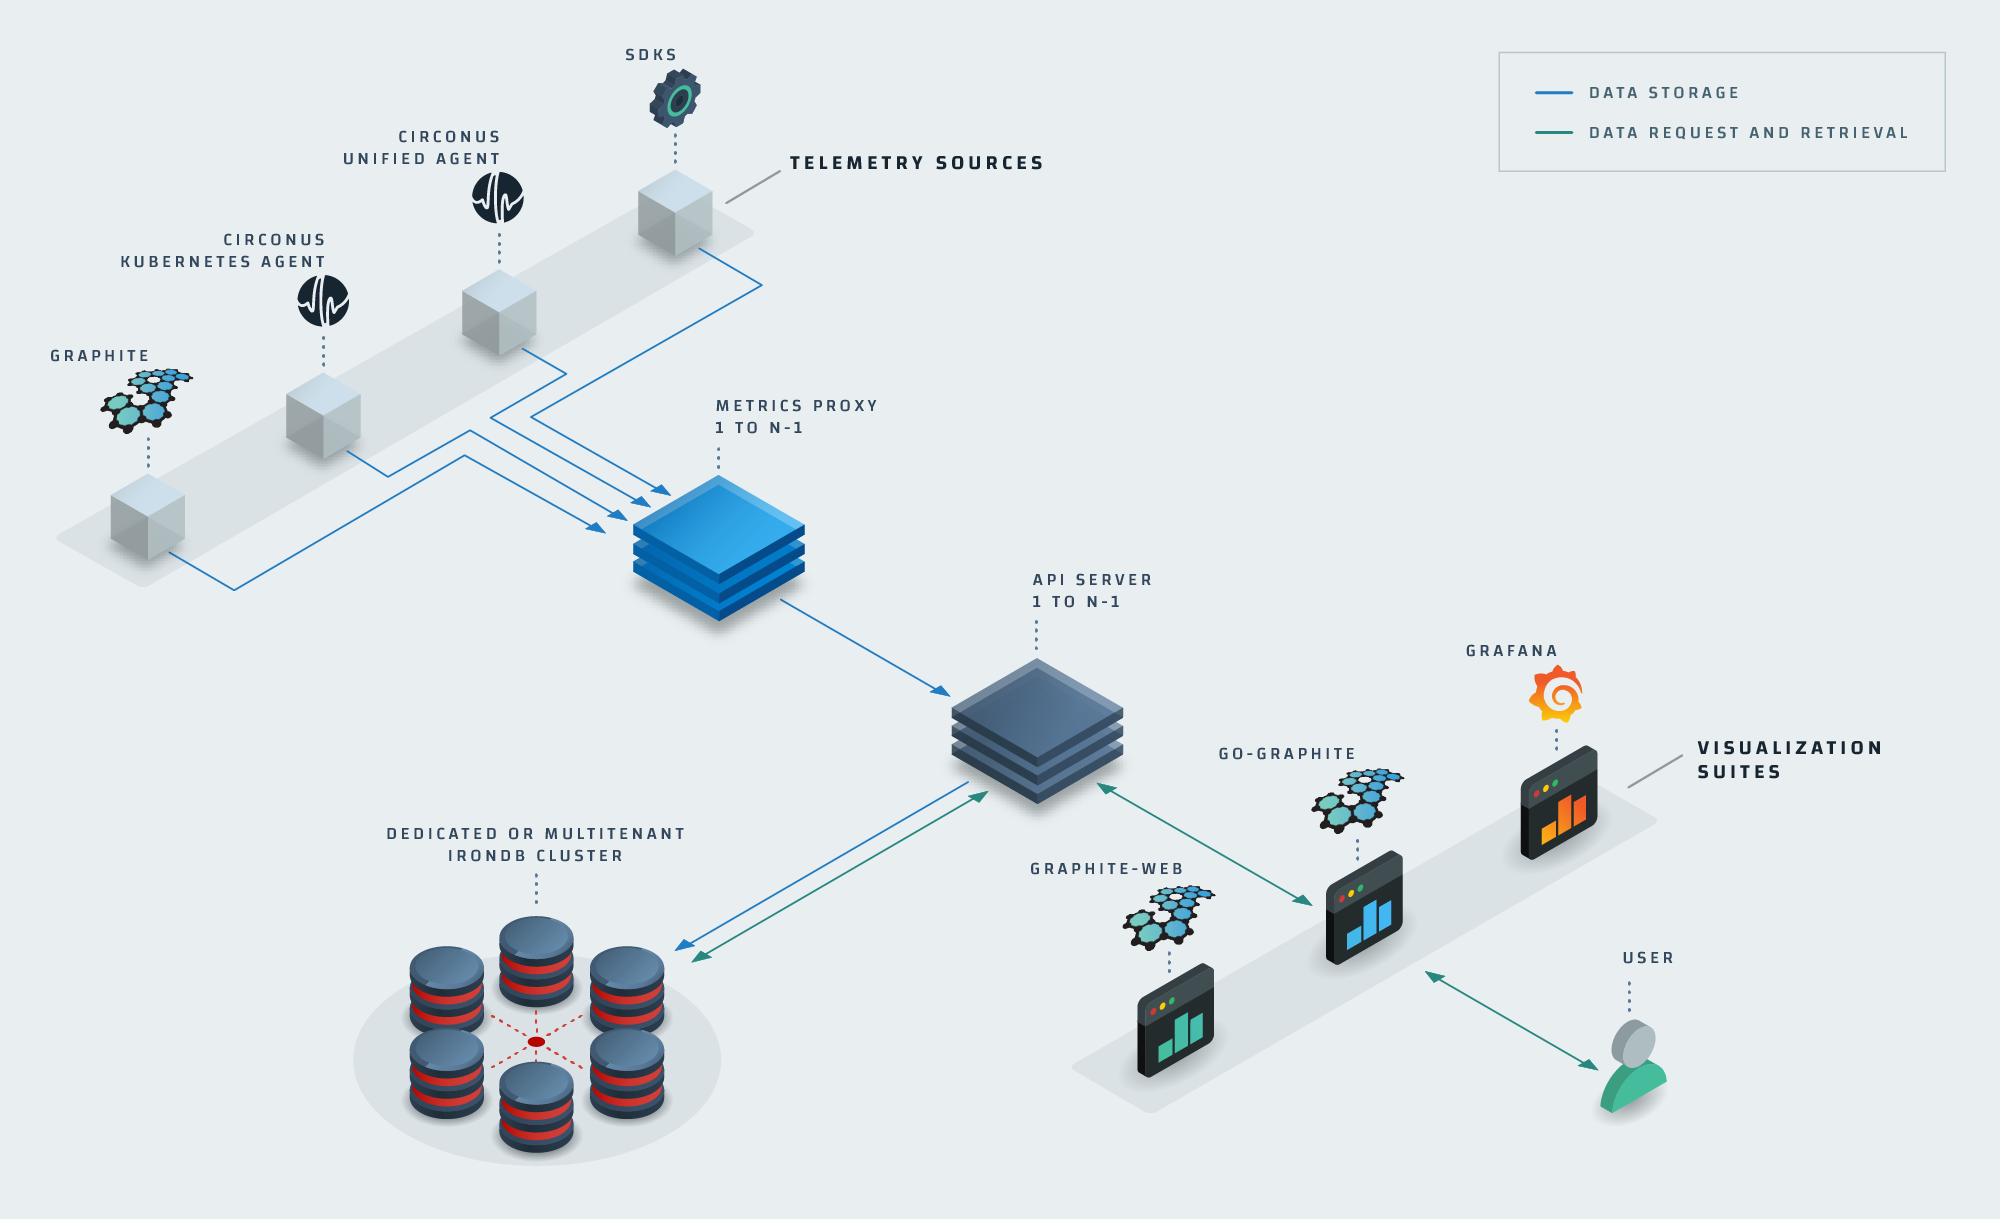
Circonus collection, processing, and visualization of various telemetry sources.
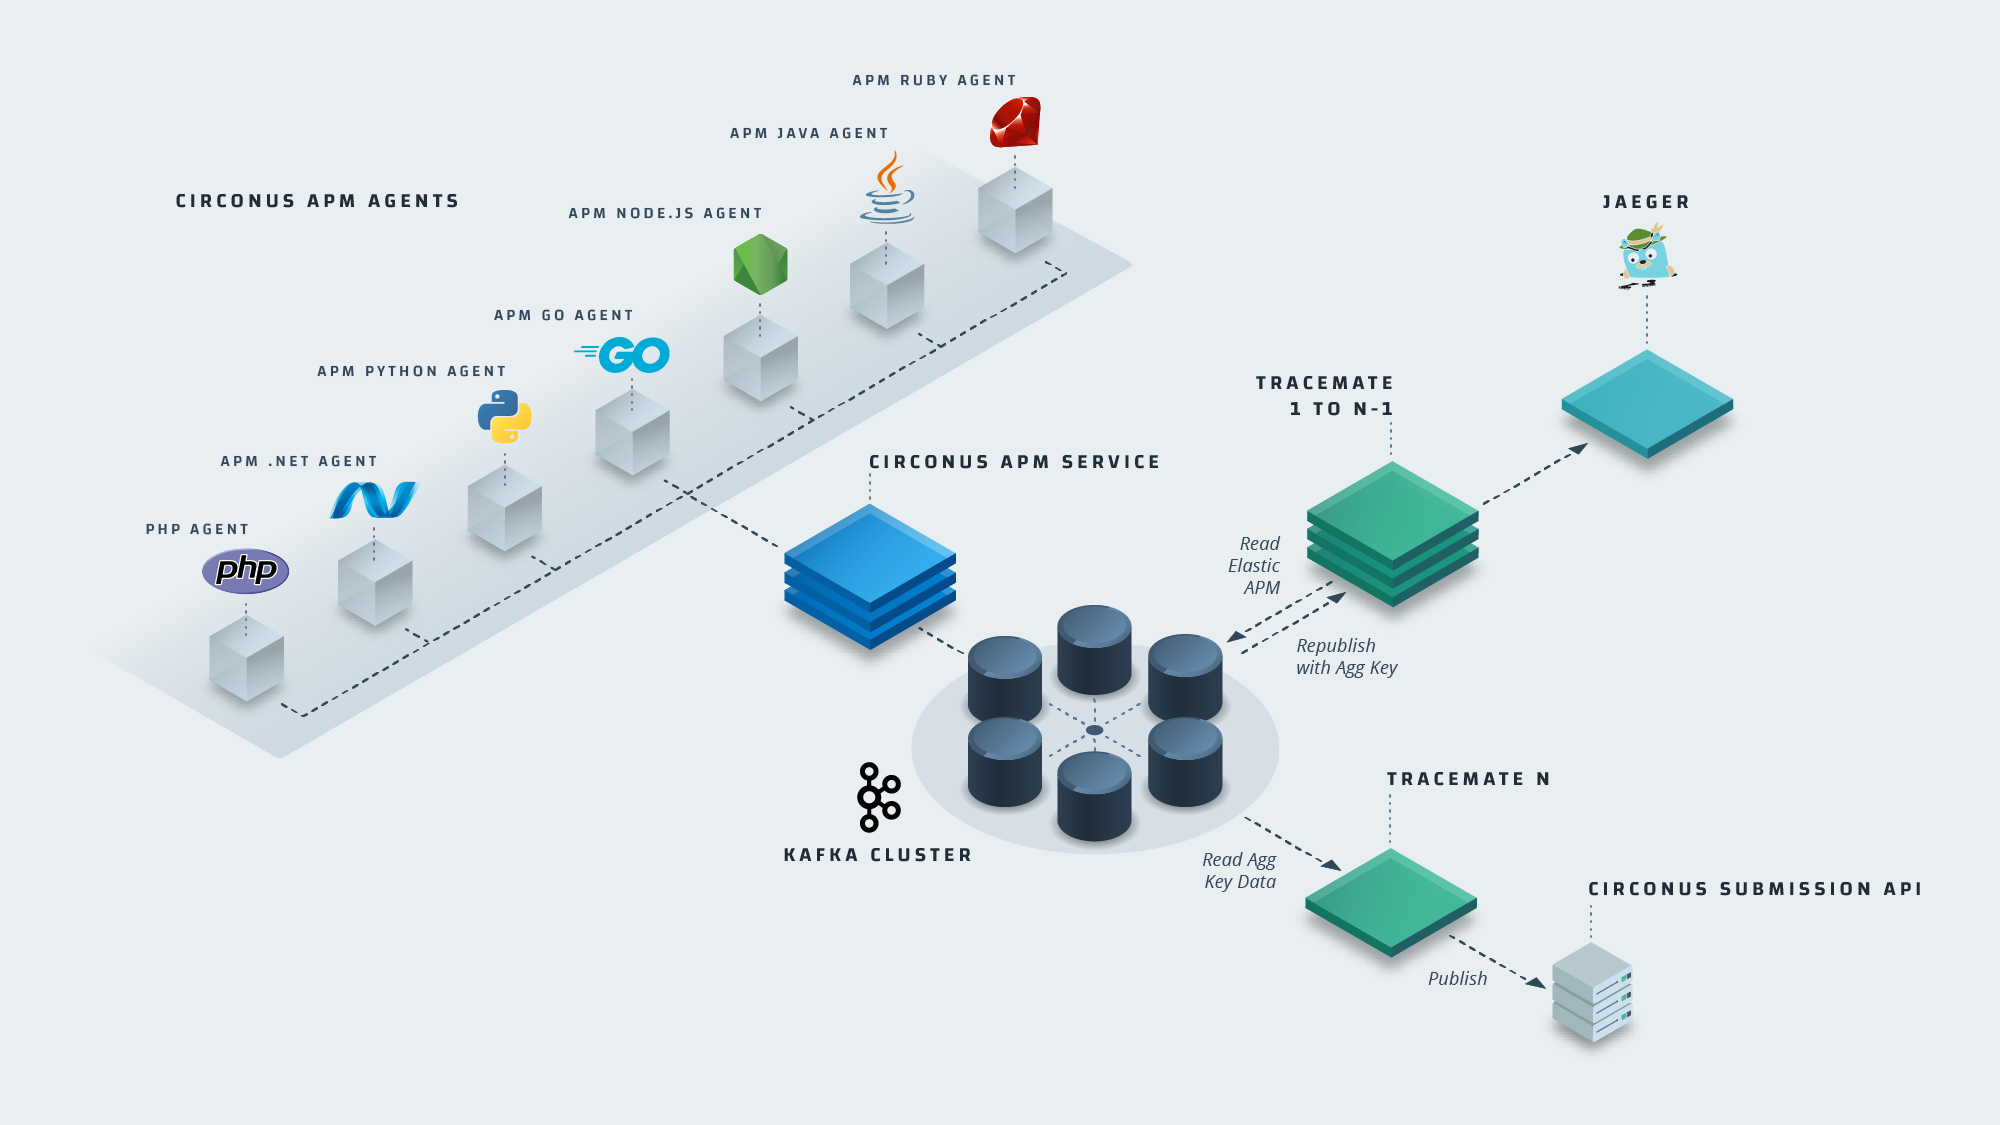
How Circonus would replace another industry tool, New Relic.